Articles
How to Get the Most out of Observability and Telemetry Across Your Applications
BY Josh Walwyn
•Tue, Aug 19, 2025
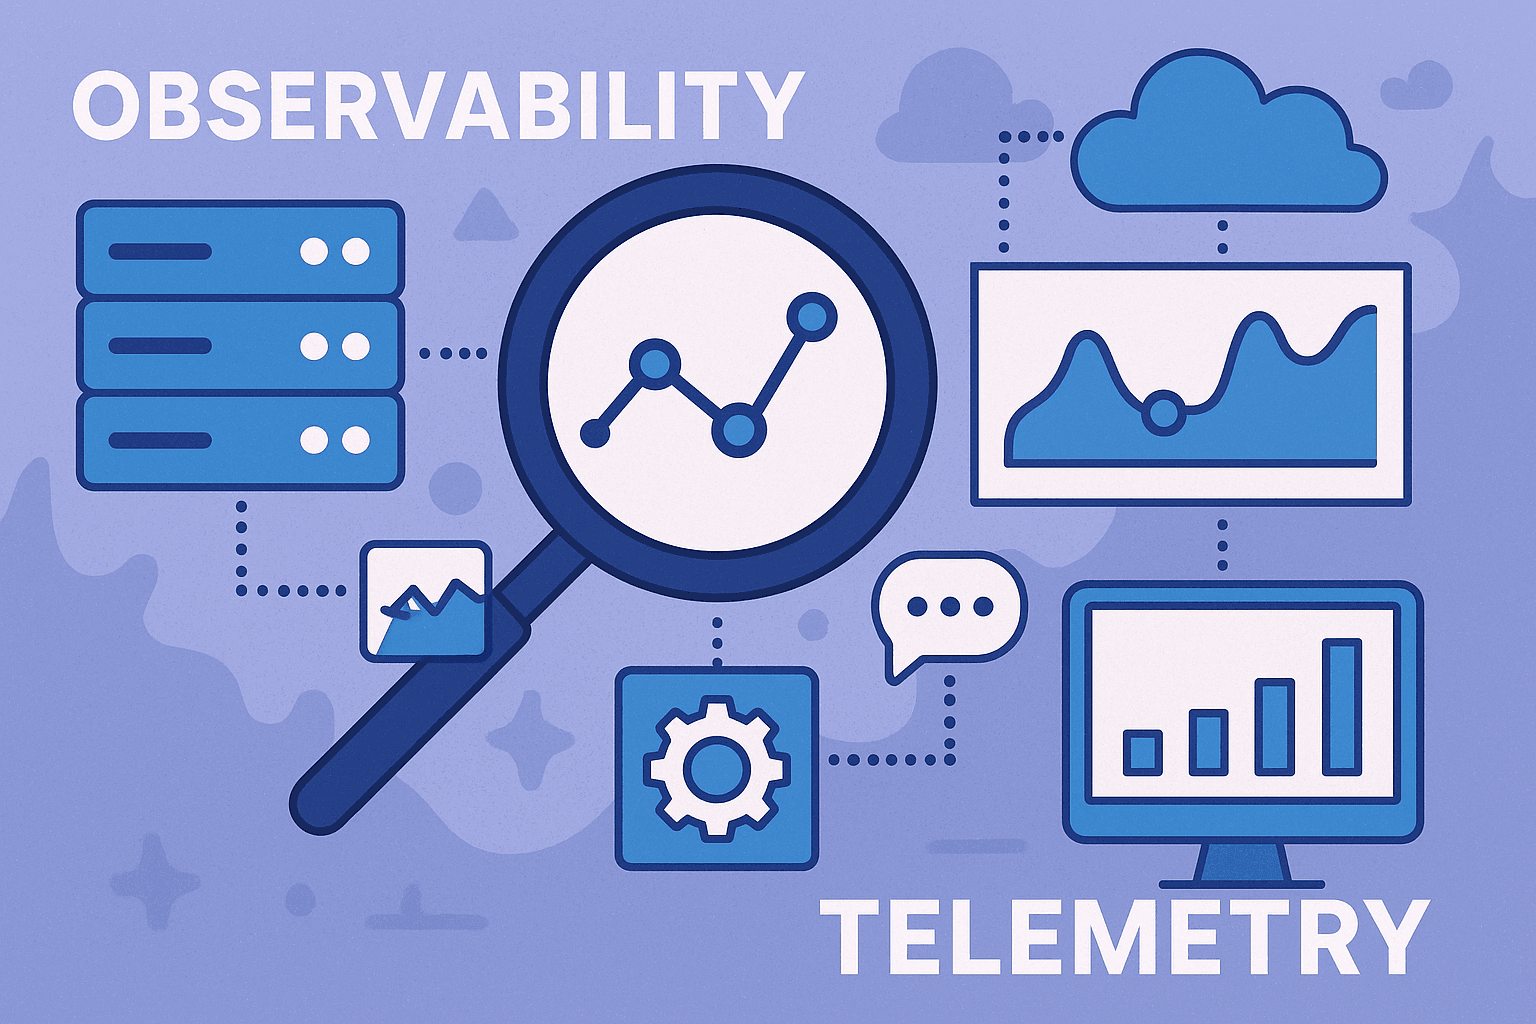
Why Observability Matters
As businesses grow and their systems scale, so does their complexity. And with it, the ability to understand their behaviour.
Observability is fundamental to ensuring your business’ systems and applications are running smoothly and effectively. Without it, what starts as minor blind spots can evolve into costly downtime, customer churn, bloated cloud bills, and a creeping erosion of trust in your product. However, by investing in a thoughtful observability and telemetry strategy, it is possible to improve comprehension of how your systems behave. Not just reacting to failures, but proactively detecting anomalies, verifying experiments, and understanding user impact.
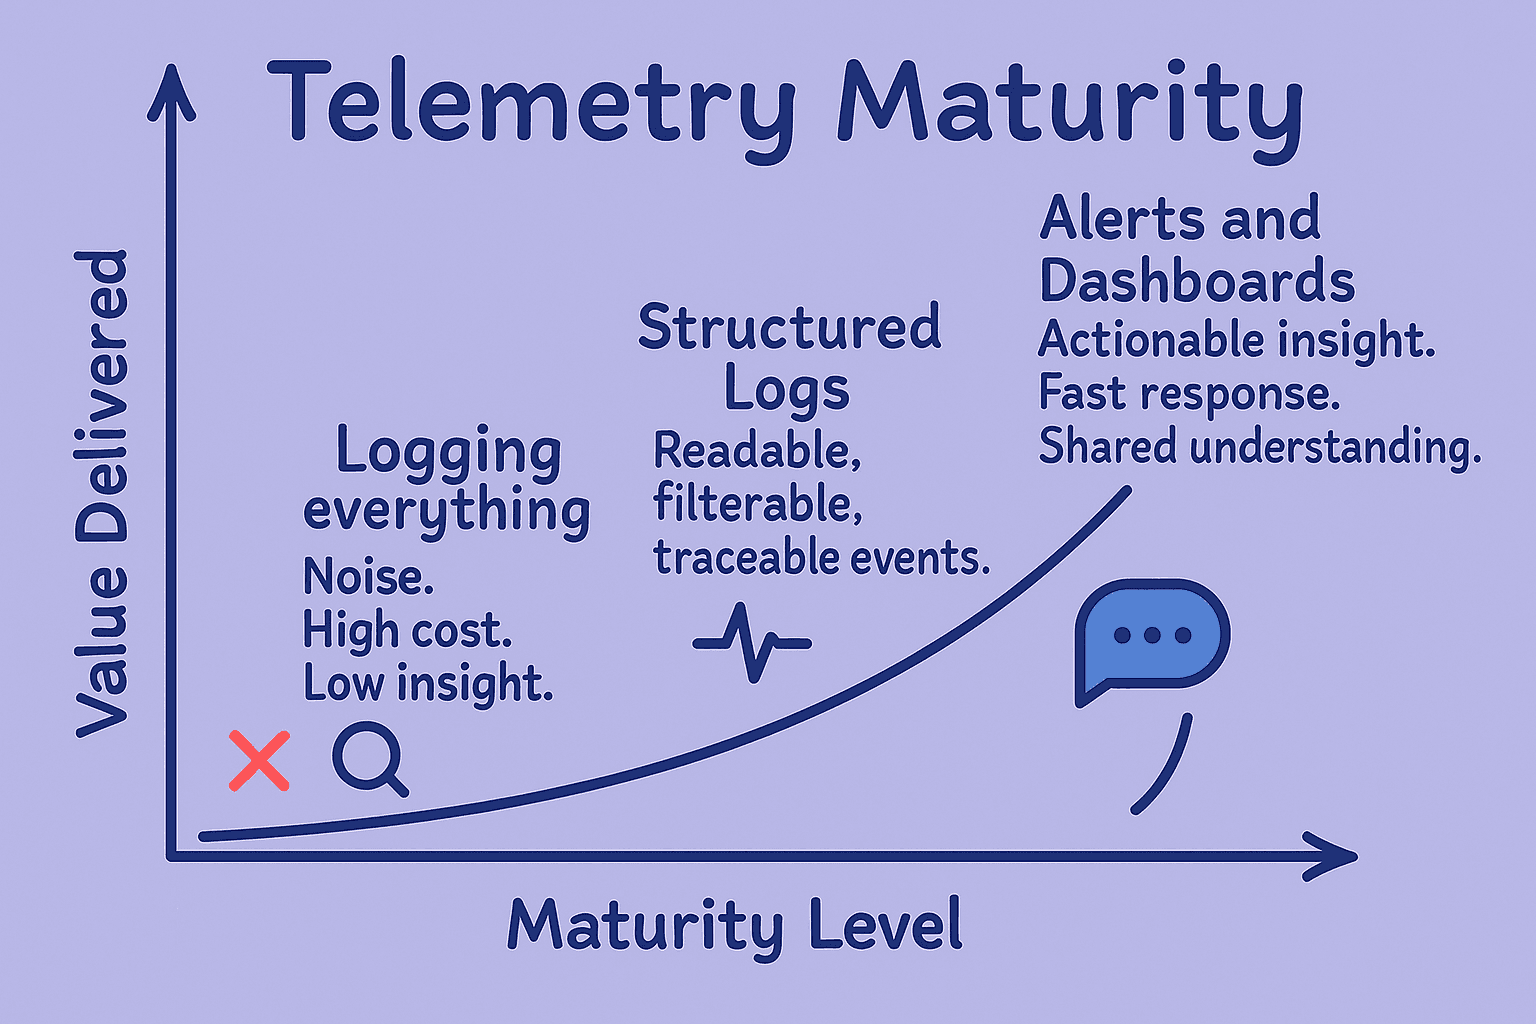
This isn’t about shipping every log to CloudWatch, Sentry, or New Relic. That will just lead to valueless noise, high costs, and limited insight.
It’s about sending the right data: structured, meaningful, and discoverable. A well-instrumented system enables faster triage, shorter time to resolution, clearer insights, and tighter feedback loops across the business.
What Happens When You Don’t Prioritise Observability?
Undetected Failures - Customer Impact and Cost
If a system lacks visibility, issues can often go unnoticed until a customer complains. For every customer that complains, how many were lost in the process? By being forced to react instead of proactively detecting and resolving problems, can erode trust, lose customers, and create a slow and frustrating feedback loop.
Root Cause Analysis - A Guessing Game
Without structured logs, traces, or metrics, debugging becomes a finger-pointing exercise. Can your developers reliably trace a failure across services, or are they left sifting through noise and gaps in telemetry to guess what went wrong?
Inhibited Feature Development - Slow Progress
Teams avoid touching parts of the system they can’t observe. Experimentation becomes risky when you can’t validate outcomes. Feature flags, A/B tests, and iterative releases are harder to trust if their impact can’t be verified. Progress slows because confidence drops, and average mean time to resolution (MTTR) of issues is high.
Spiralling Costs - Time and Money
Shipping every log and every error isn’t observability - it’s waste. Storing terabytes of unstructured data drives up platform costs without delivering actionable value. Worse, it slows down engineers trying to uncover useful information. Adding friction to every incident response.
Using the Right Tools and Instrumenting for Success
A good usability strategy isn’t simply about the tools you choose, but rather how you use them.
There are three pillars of observability that each serve a distinct purpose:
1. Structured Logs - give detailed context and visibility at each key event of an application and user journeys. A cohesive structure is essential for filtering and correlation - especially during incidents.
2. Metrics - these help monitor trends and trigger alerts. These can be parsed through structured event log, or APM (application performance monitoring) systems, enabling tracking of SLIs (Service Level Indicators) such as latency, error rates, and throughput.
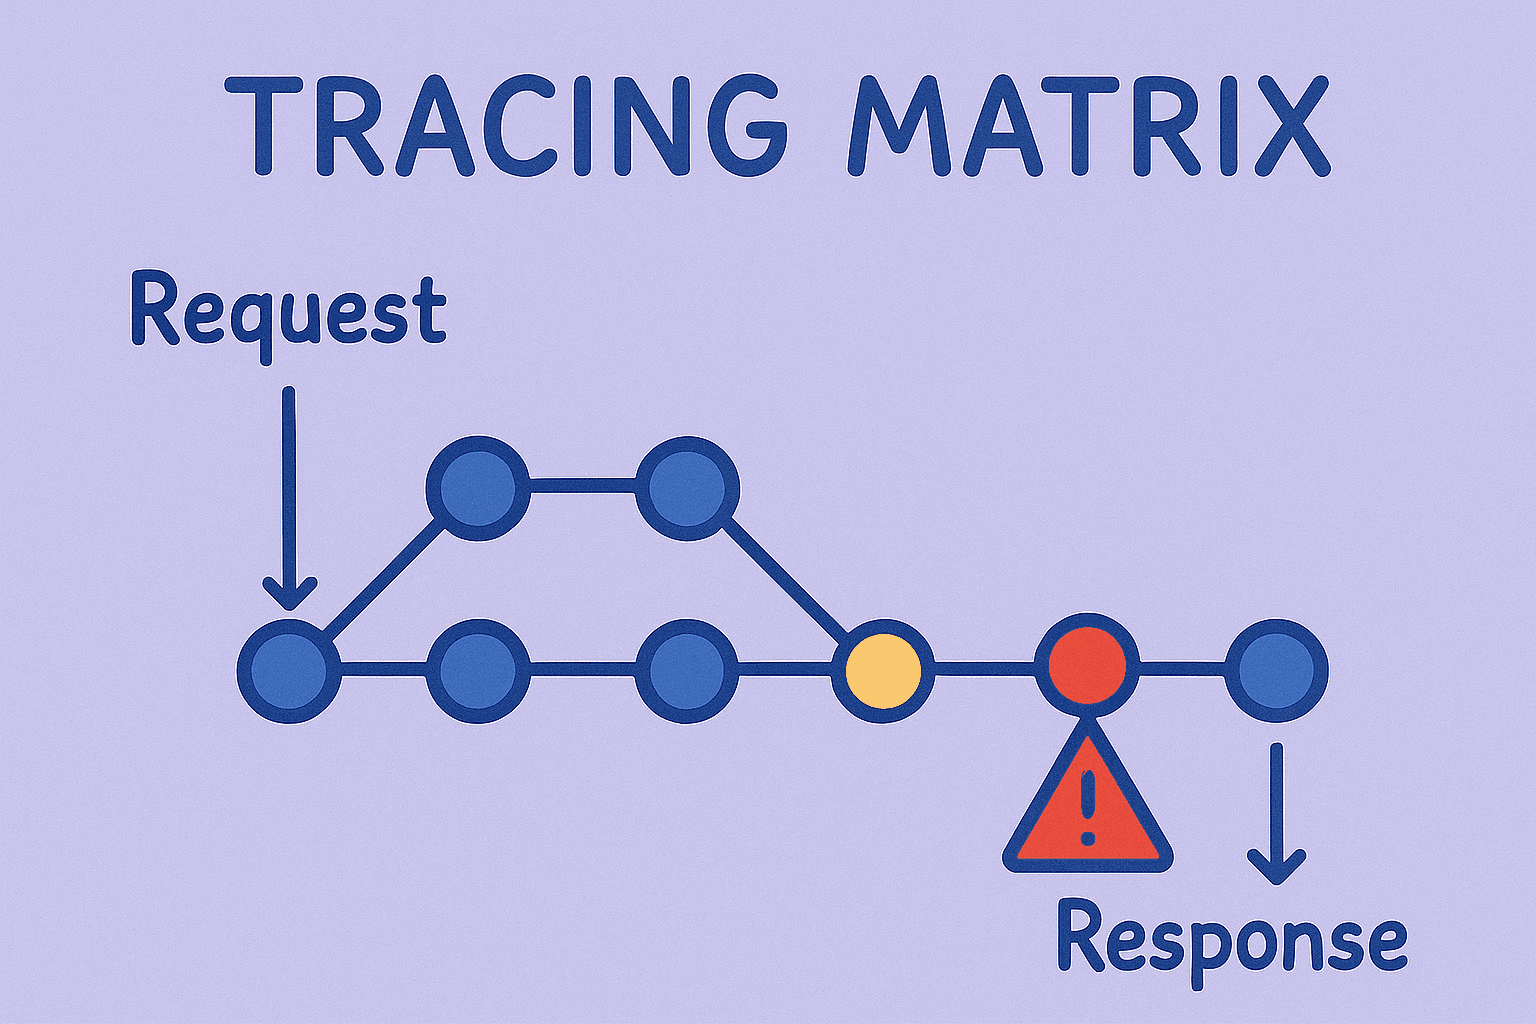
3. Traces show how requests flow through a system. They are invaluable for debugging distributed architectures, allowing issues to be effectively tracked to causations.
By just forwarding every single event we are just creating noise. Engineers will tend to ignore this, driving up costs and reducing value. Have you seen how expensive shipping terabytes of useless information a day can get?
Not everything needs to be traced, logged, or alerted on. Our advice is to focus on the golden paths, revenue-critical systems, and workflows where early detection has real beneficial impact.
Tools, Dashboards, and Alerts
Choosing the right tools - whether its New Relic, Prometheus, CloudWatch, or Logstash, is secondary to establishing the right instrumentation discipline.
Effective Dashboards
Dashboards should be grouped by purpose, and focus should be specific. Avoid a wall of charts and focus on the signal a dashboard should - use them to visually relay abnormalities and anomalies.
Alerting That Works
It is worth asking yourself a few simple questions. How many system alerts get ignored at your current organisation? What value are they currently bringing? How fast does it take to action and resolve revenue-impacting issues?
Alerts should predominantly be tailored to things that need immediate or near time resolution. Alert on SLO breaches, not every blip (not a one off internal server error - but a spike in 500s?). Think about how alerts can be grouped into P1s and P2s and their subsequent escalation policies. What would you understand causing an interruption in the midst of night slumber if you were the on call engineer that evening?
Using platforms such as Slack or PageDuty can help alerts get noticed and actioned. A generic slack channel for alerts can be useful for generic warnings and alerts and updates, but an alert that needs to be actioned should be shouted out on more visible channels.
An alert no one acts on or acknowledges is worse than no alert at all. This is setting you up to treat alerts as noise and creating an anti-pattern of noise.
What Good Looks Like - Unlocking Your Value
The goal of observability isn’t just more dashboards, data, and alerts - it’s faster understanding and better decisions through discoverability and measurability.
A well-instrumented system doesn’t just produce metrics and logs that are lost in the ether - but instead provide engineers with confidence. It tells product teams what's working. And it helps the business move faster without too much guess work.
Engineering Outcomes
Engineers can identify and triage issues independently. Instead of playing tennis with issues, an engineer can trace the root cause.
Dashboards are actually used, focusing on SLIs and visualising core data
Alerts are respected and triaged. They are not noise that are ignored.
Operational Flow
MTTR (mean time to resolution) drops - this leads to happier customers (without waiting for laborious resolutions) and allows engineers to focus their time in more important areas. Issues are spotted early and debugged fast.
Post-mortems have clear timelines and contributing factors. The data is already there.
Teams fix root causes, not just symptoms because they can trace user journeys end-to-end.
Business Confidence
Experimentation becomes faster and safer - impact can be verified in real time
Revenue-impacting systems (ads, payments, subscriptions) are actively monitored with SLOs
Trust in the numbers - what’s being tracked reflects how the system is actually being used, and how it’s performing.
Tying multiple data sources together - have you seen a drop in advertisement revenue for example? Well, we can also see that we are serving less ad units through our consumer applications for example.
Good Observability reduces the time between “something’s wrong” and “I know why.”
It is not about perfection, but an ongoing journey around clarification, alignment, and continuous improvement. When observability becomes a part of your culture, not just an after thought tacked on at the end, then the benefits compound across your organisation.
How we boosted web speed and cost savings for Timeout through improved observability.
If you are looking for guidance on how to improve the observability of your systems and applications, take a look here at what we can offer or get in touch for a free consultation.